Site pages
Master of Science
Professional Master
1st Year
2nd Year
3rd Year
Participants
General
Lectures (2012-13)
Assignments & Solutions (2012-13)
Videos, Animations and Movies
Lectures (2011-12)
Assignments & Solutions (2011-12)
Project (2011-12)
Exams (2011-12)
2nd Semester
Miscellaneous
Project Description
PERFORMANCE EVALUATION OF COMPUTER NETWORKS
It is required to evaluate the performance of a prototype computer network using standard network simulation tools. The process will proceed in two phases as explained below:
Phase I:
1 - Selecting and installing a network simulation software. It is highly recommended to use ns-2 open source software ( http://www.isi.edu/nsnam/ns/ ). Two options are available for ns-2 installation: using LINUX OS (UBUNTU) or using Windows OS. The choice is completely up to the Student Group.
2 - Getting familiar with ns-2 capabilities for: entering a network description, running the simulation for the entered network, capturing the results of simulation, plotting performance curves, and carrying out network animation. The Student Group should learn how to save the output files for the simulation, for the performance curves, and for the animation in order to reproduce the results later on.
3 - Perform "Test Run" for the installed ns-2 using the following network topology:
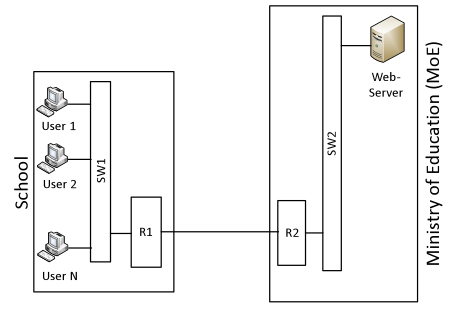
Assume:
- Distances between any switch and the devices connected to it (e.g. users, routers, servers) = 100 m
- Distance between R1 and R2 = 6 km
- Propagation speed over LAN links = 2x10⁸ m/s
- Propagation speed over WAN link = 1x10⁸ m/s
- All ports of switches SW1 and SW2 operate at speed 100 Mbps
- WAN ports for R1 and R2 operate at speed 2 Mbps
4 - Carryout simulation for the above network assuming 20 PC's in the school, where each PC produces packets at rate 60 packets per second.
5 - Calculate the average end-to-end delay and the throughput for the above network.
6 - Document the results of your simulation using: proper network topology graphs, tcl & c++ code for ns-2, and performance curves.
Phase II:
Note that this part is subject to change.
1 - Simulate a prototype design for the Computer Network of the Faculty of Engineering/Cairo University (details will be announced at a later date).
2 - Obtain the performance results for the simulated network, including:
- Average end-to-end delay for an FTP transaction (LAN access, WAN access, overall).
- Average user throughput (LAN access, WAN access, overall).
3 - Document the results of your simulation using: proper network topology graphs, tcl & c++ code for ns-2, and performance curves.
Deliverables and their Schedule
a) Initial Setup (Items 1, 2, 3, 4, 5, and 6 - Phase I) : Sunday, 25 November 2012
b) Detailed Performance Evaluation (Items 1, 2, and 3 - Phase II): Sunday, 16 December 2012
Action Plan and Marking
- Groups of 4 to 6 students are to be formed. The names for the members of the group are to be sent to Eng. Rania OSAMA ( eng_raniaosama@yahoo.com )
- Members of each group are encouraged to gather needed information by consulting books, papers, resources on the web, as well as by asking Demonstrators and Professors). All sources of information should be referenced clearly in each deliverable.
- Each group will be given a mark for EACH of the THREE deliverables.
- Each member of the group will be given a mark based on his/her understanding and contribution to the project. Such a mark will be determined by the Course Instructor through an oral session to be set during the last week of December.