Question (1)
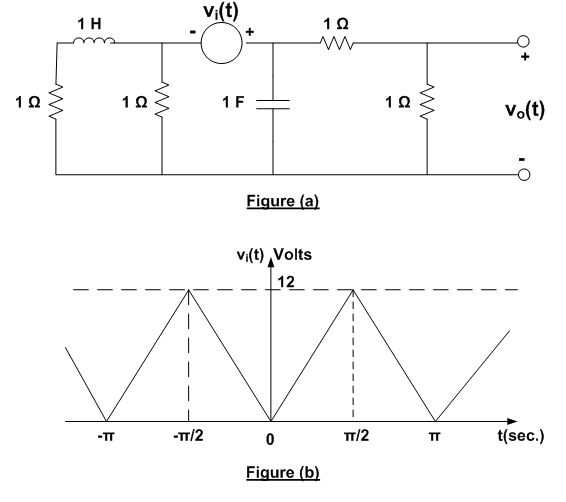
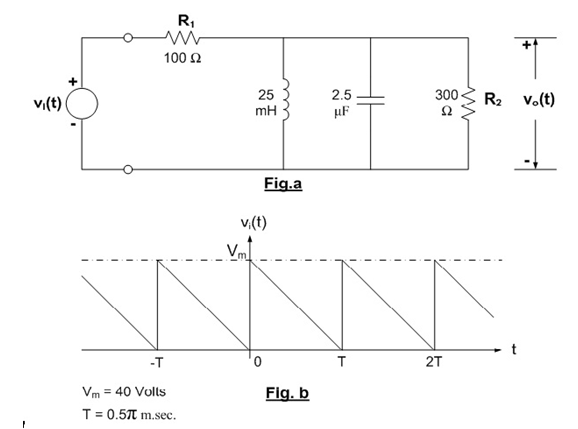
a)Derive an expression of the steady-state output voltage vo(t) for the circuit shown
in figure (a) if the input voltage to the circuit vi(t) is the periodic waveform shown in
figure (b) .
b)Sketch the double-sided magnitude and phase spectra of the output voltage vo(t) in
the frequency range lωl<10 rad./sec. What would be the average power delivered
to the output terminals in this frequency range ?
Question (2)
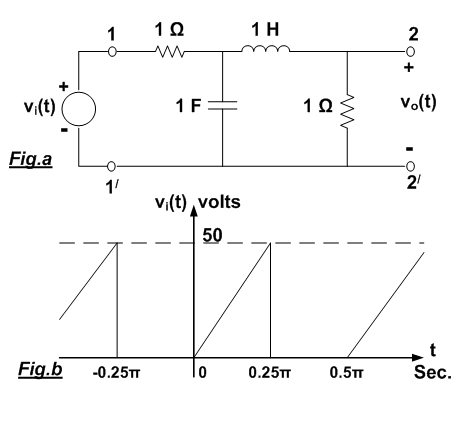
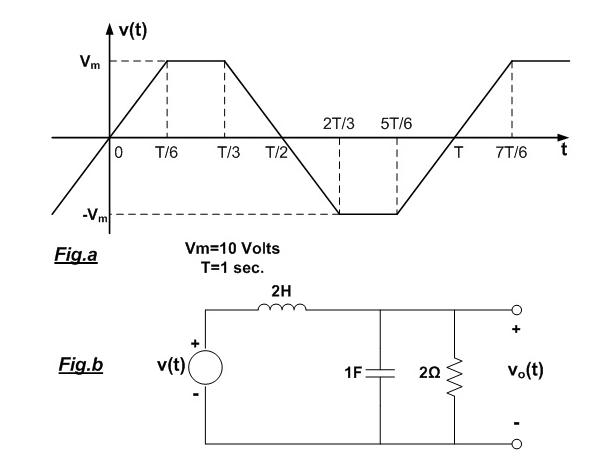
The circuit shown in figure a has an input voltage source vi(t) described by the periodic waveform shown in figure b. For the frequency range
l ω l < 10 rad./sec. :
i)Derive a series expression for the steady-state output voltage vo(t).
ii)Sketch the double-sided magnitude and phase spectra of vo(t).
iii)Calculate the average power delivered to the circuit at its input terminals 1-1'.
iv)What would be the average power obtained at the output terminals 2-2' ?
Question (3)
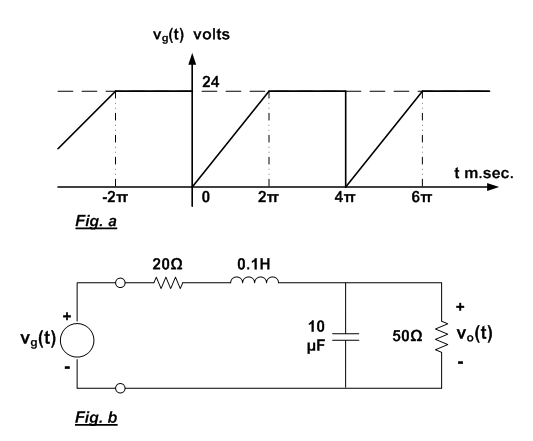
The periodic voltage signal vg(t) shown in figure a is applied as an input to the circuit shown in figure b. For the frequency range
|f|< 250Hz :
i)Derive a trigonometric Fourier series expansion for the steady-state output voltage
vo(t).
ii)Calculate the percentage of the input average power to the circuit that is available
at its output .
Question (4)
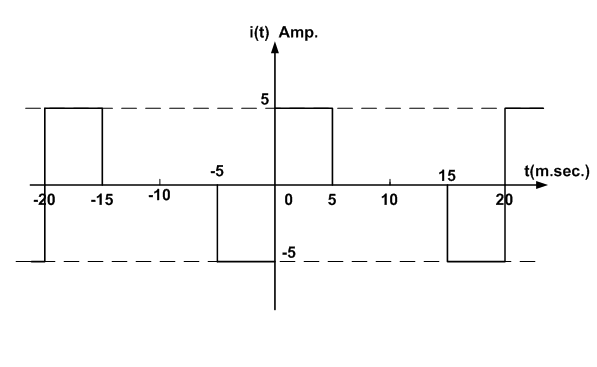
The periodic current waveform i(t) shown in figure exists in a 24 Ω resistor.Make the necessary derivations to :
i)Calculate an expression for the complex Fourier series representing i(t).
ii)Evaluate the total average power delivered to the resistor.
iii)Define the range of frequencies in Hertz containing not less than 85 % of the total
average power delivered to the resistor and sketch the double-sided magnitude
and phase spectra of the current i(t) in this frequency range.
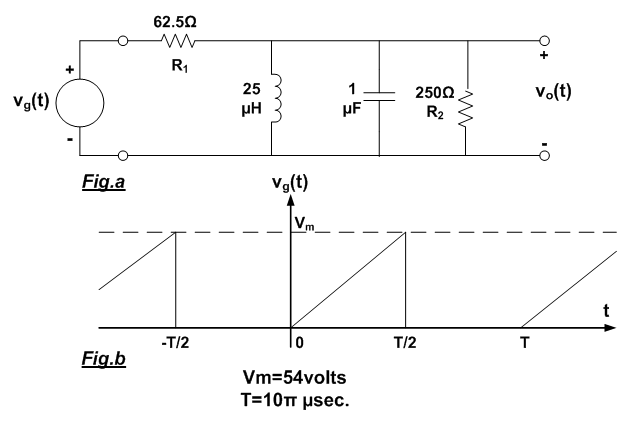
Question (5)
The periodic voltage vg(t) applied to the circuit shown in Fig.a has the waveform given in Fig.b . For the frequency range
| f | <80 KHz :
i)Derive an expanded trigonometric series expression for the steady-state output
voltage vo(t).
ii)Sketch the single-sided amplitude and phase spectra of the voltage vo(t) in volts
and degrees against frequency in Hertz.
iii)Calculate the average power delivered to each of the resistances R1 and R2 .
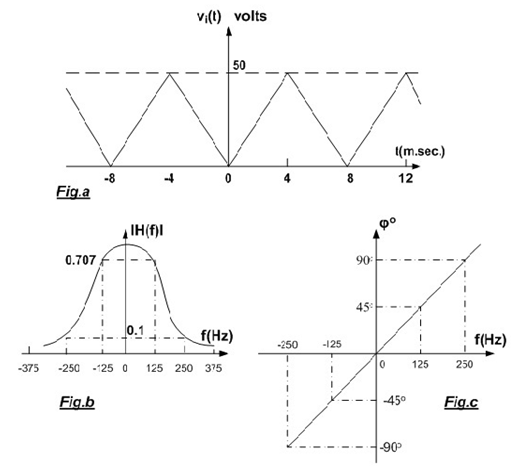
Question (6)
The voltage signal vi(t) shown in Fig.a is fed to a system H that is described in magnitude and phase by Figs.b and c :
i)Derive the time domain expression of the output voltage signal of the system vo(t).
ii)Calculate the effective values of the input and output voltage signals of the
system.
iii)Sketch the double-sided amplitude and phase spectra of the output voltage signal
vo(t) in volts and degrees against frequency in Hertz .
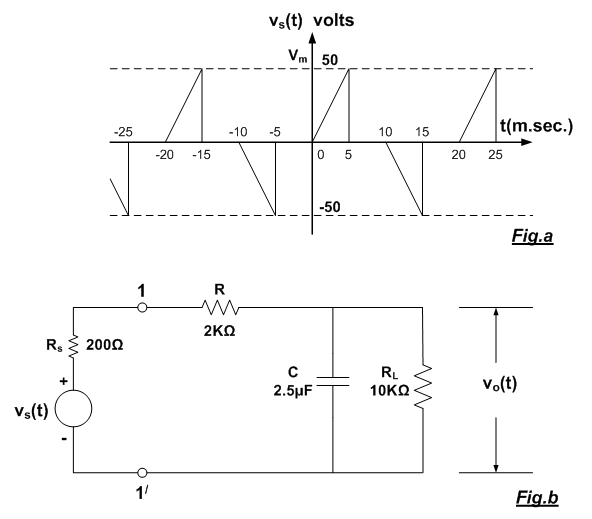
Question (7)
The Periodic voltage signal vs(t) shown in Fig.a is used to energize the loaded low pass filter shown in Fig.b . For the frequency range |f|< 250 Hz :
i)Derive an expanded trigonometric Fourier series for the steady-state output voltage
vo(t) .
ii)Sketch the single-sided amplitude and phase spectra of vo(t) in volts and degrees
againstfrequency in Hertz .
iii)Calculate the average power delivered to the filter at its input terminals 1-1' .
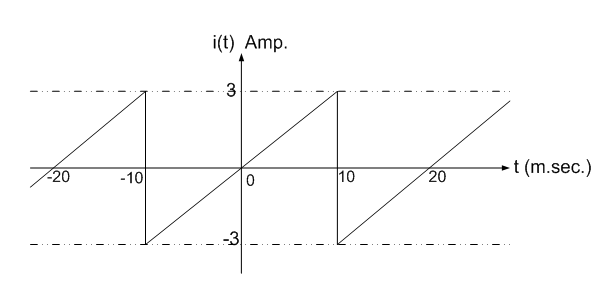
Question (8)
The current i(t) passing through a 50 Ω resistor R has the periodic saw tooth waveform shown in figure. Make the necessary derivations to :
i)Calculate an expression for the complex Fourier series representing the current i(t) .
ii)Evaluate the total average power delivered to the resistor R .
iii)Define the range of frequencies in Hertz containing not less than 80 % of the total
average power delivered to the resistor R and sketch the double-sided amplitude
and phase spectra of the current i(t) in this frequency range .
Question (9)
The periodic voltage vi(t) applied as an input to the circuit shown in Fig.a has the waveform given in Fig.b . For the frequency range
│f│< 1.5 KHz :
i)Derive an expanded trigonometric series expression for the steady-state output
voltage vo(t) .
ii)Sketch the single-sided amplitude and phase spectra of the output voltage vo(t) in
volts and degrees against frequency in Hertz .
iii)Calculate the average power delivered to each of the resistances R1 and R2 .
Question (10)
The trapezoidal voltage signal shown in Fig.a is applied to the circuit shown in Fig.b :
i)Determine the expression of the steady-state output voltage vo(t).
ii)Sketch the double-sided amplitude and phase spectra of the output voltage vo(t) in
thefrequency range | f |< 6 Hz.